Designing on-demand, remote hypertension care
Improving the quality and quantity of life for people with hypertension, by designing a longitudinal care program that blends behavioral health, text-forward primary care, and connected devices.
2022, Principal designer
Hypertension is the silent killer
Nearly half of American adults suffer from hypertension, which is the leading risk factor for cardiovascular disease, stroke and chronic kidney disease, according to the Centers for Disease Control and Prevention (CDC). Cardiovascular disease is listed as the cause of 1 in 3 deaths each year in the U.S. Hypertension is one of the few diseases where guidelines favor home monitoring over in-person monitoring, which makes this an exciting disease to take on.
A new strategy: longitudinal care
We set out to build and launch our first longitudinal care program that blends behavioral health, primary care, and connected devices to drive positive outcomes for patients with hypertension and pre-hypertension to drive our longitudinal care business strategy.

How might we…
Diagnose, monitor, and manage hypertension longitudinally so that we can improve the quality and quantity of life for patients with hypertension and pre-hypertension?
Building trust with our clinic
In order to understand our physician’s key needs, I facilitated two listening sessions with them. Prior research surfaced the incredibly complex and diverse workflows our physicians need to remember while practicing in our clinic. Our listening session affirmed the pain of complex workflows and the need to not add to the cognitive burden of practicing medicine in our virtual clinic.
Key physician needs:
Clear next steps
Make it clear to physicians what to do next during each Heart Health program visit
Provide shortcuts
Provide shortcuts that make physician workflow steps easier and lower in cognitive burden
Actionable objective data
Make it easy for physicians to confidently do the right thing based on a patient’s objective data
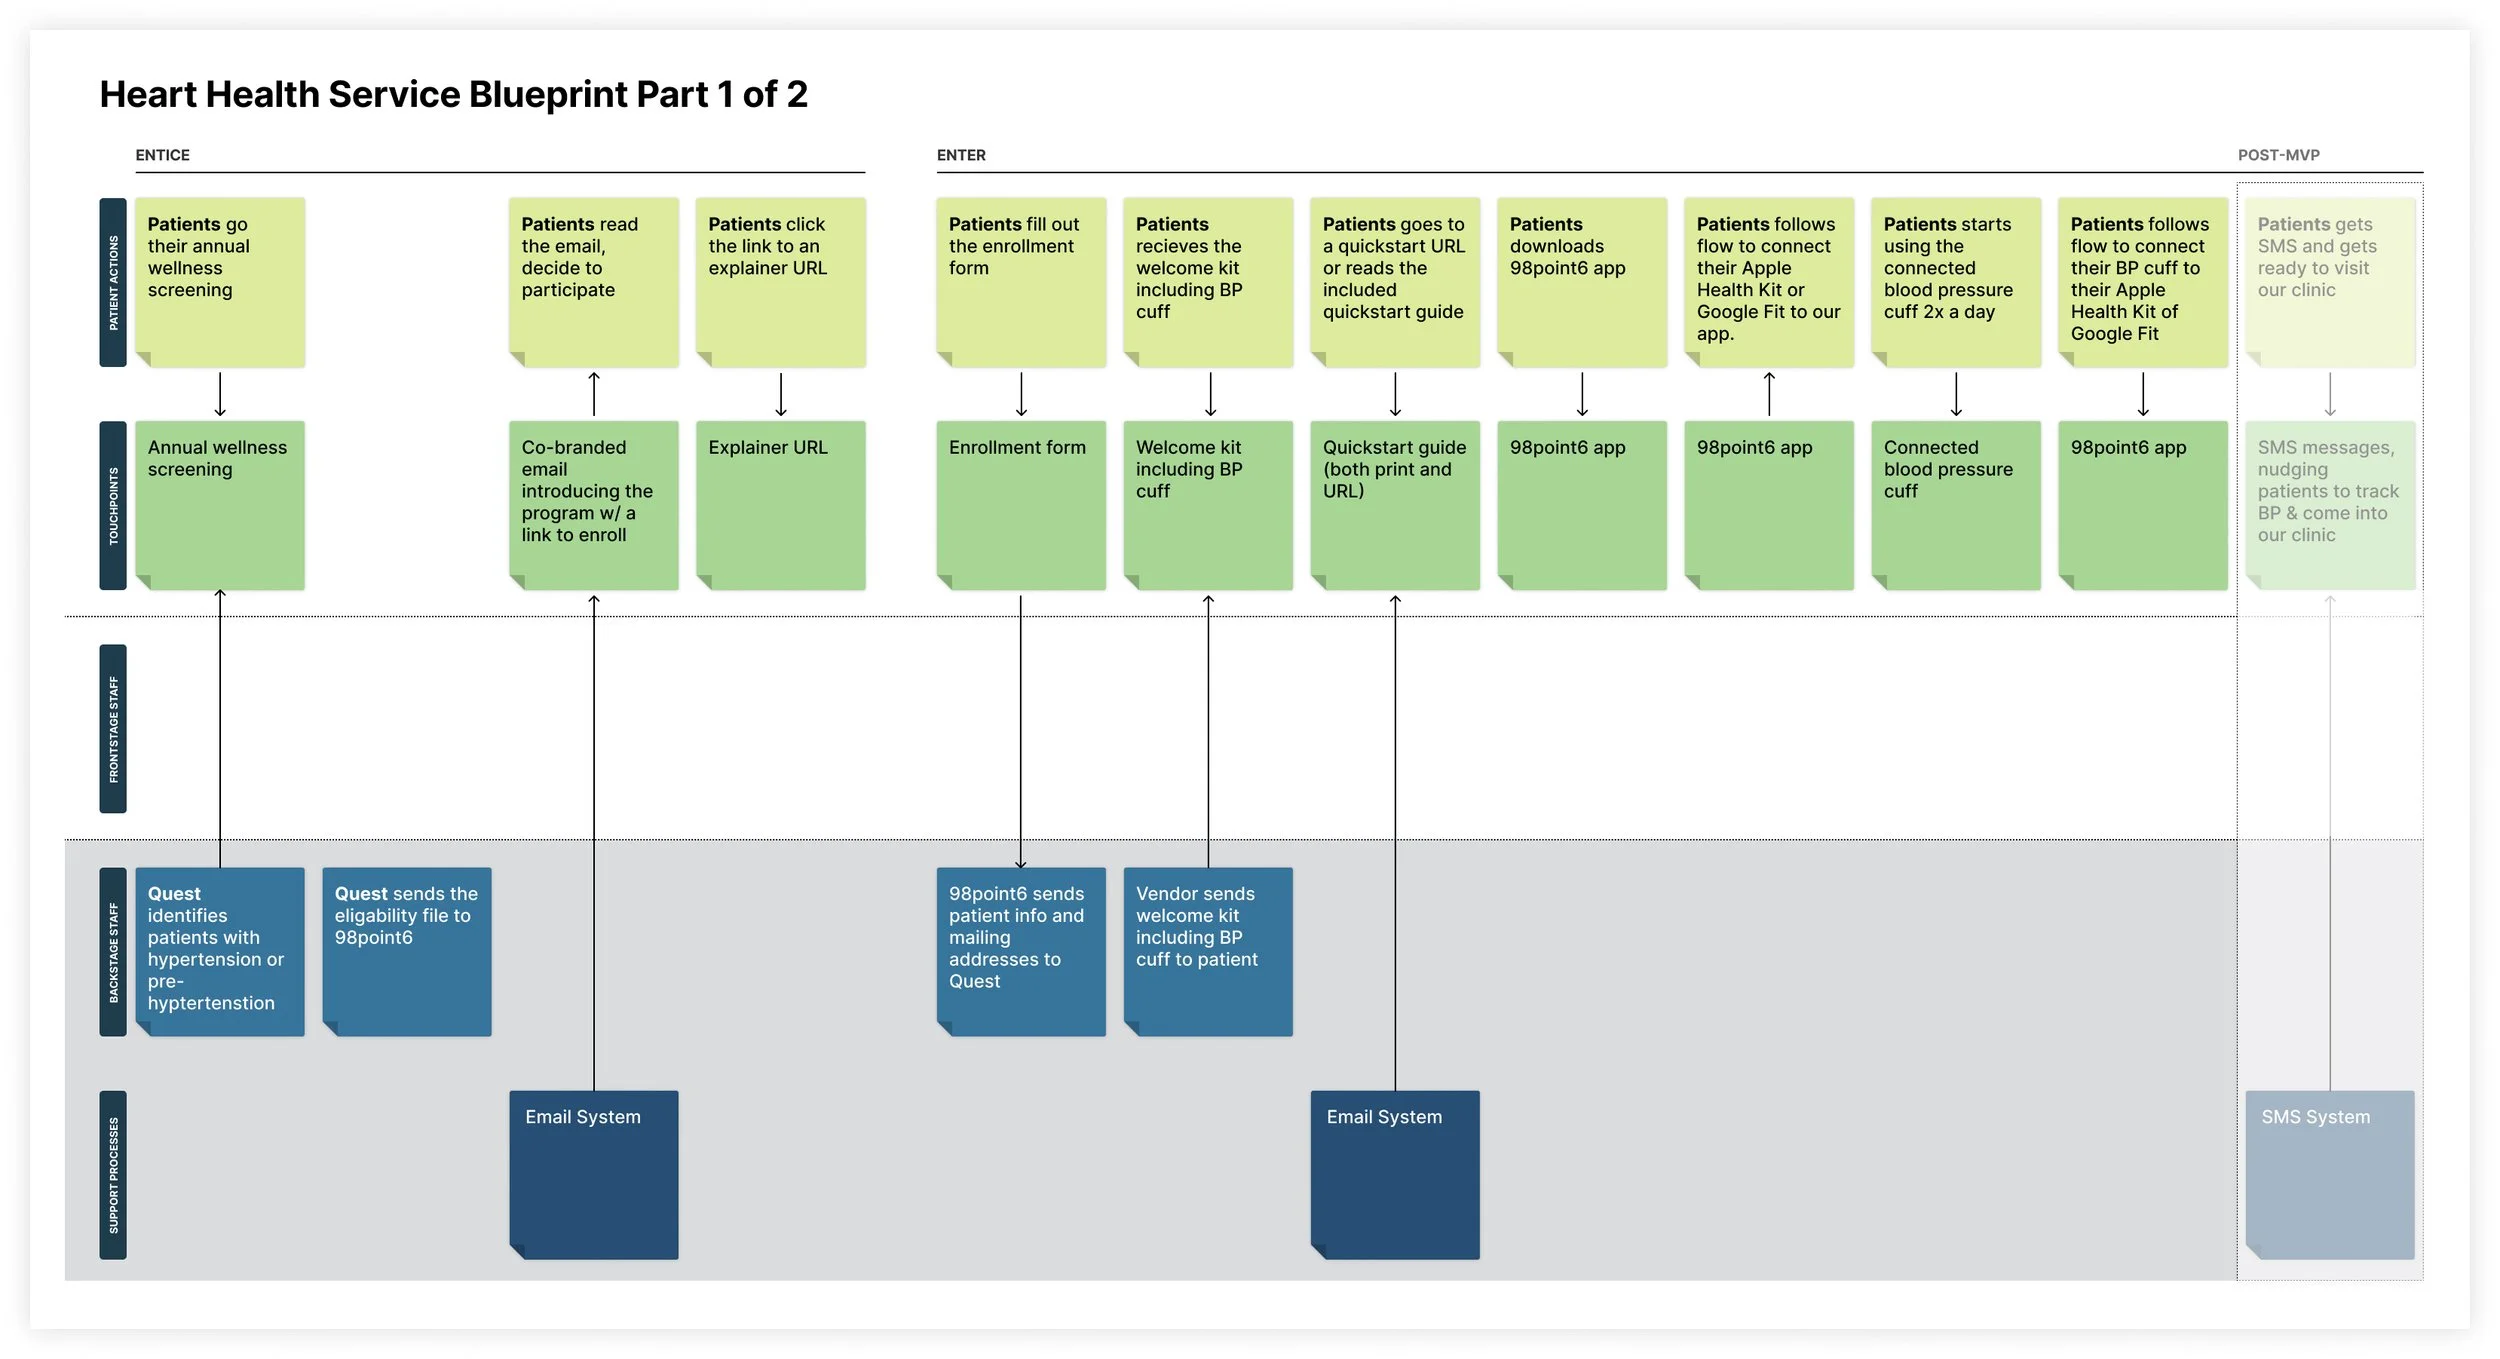
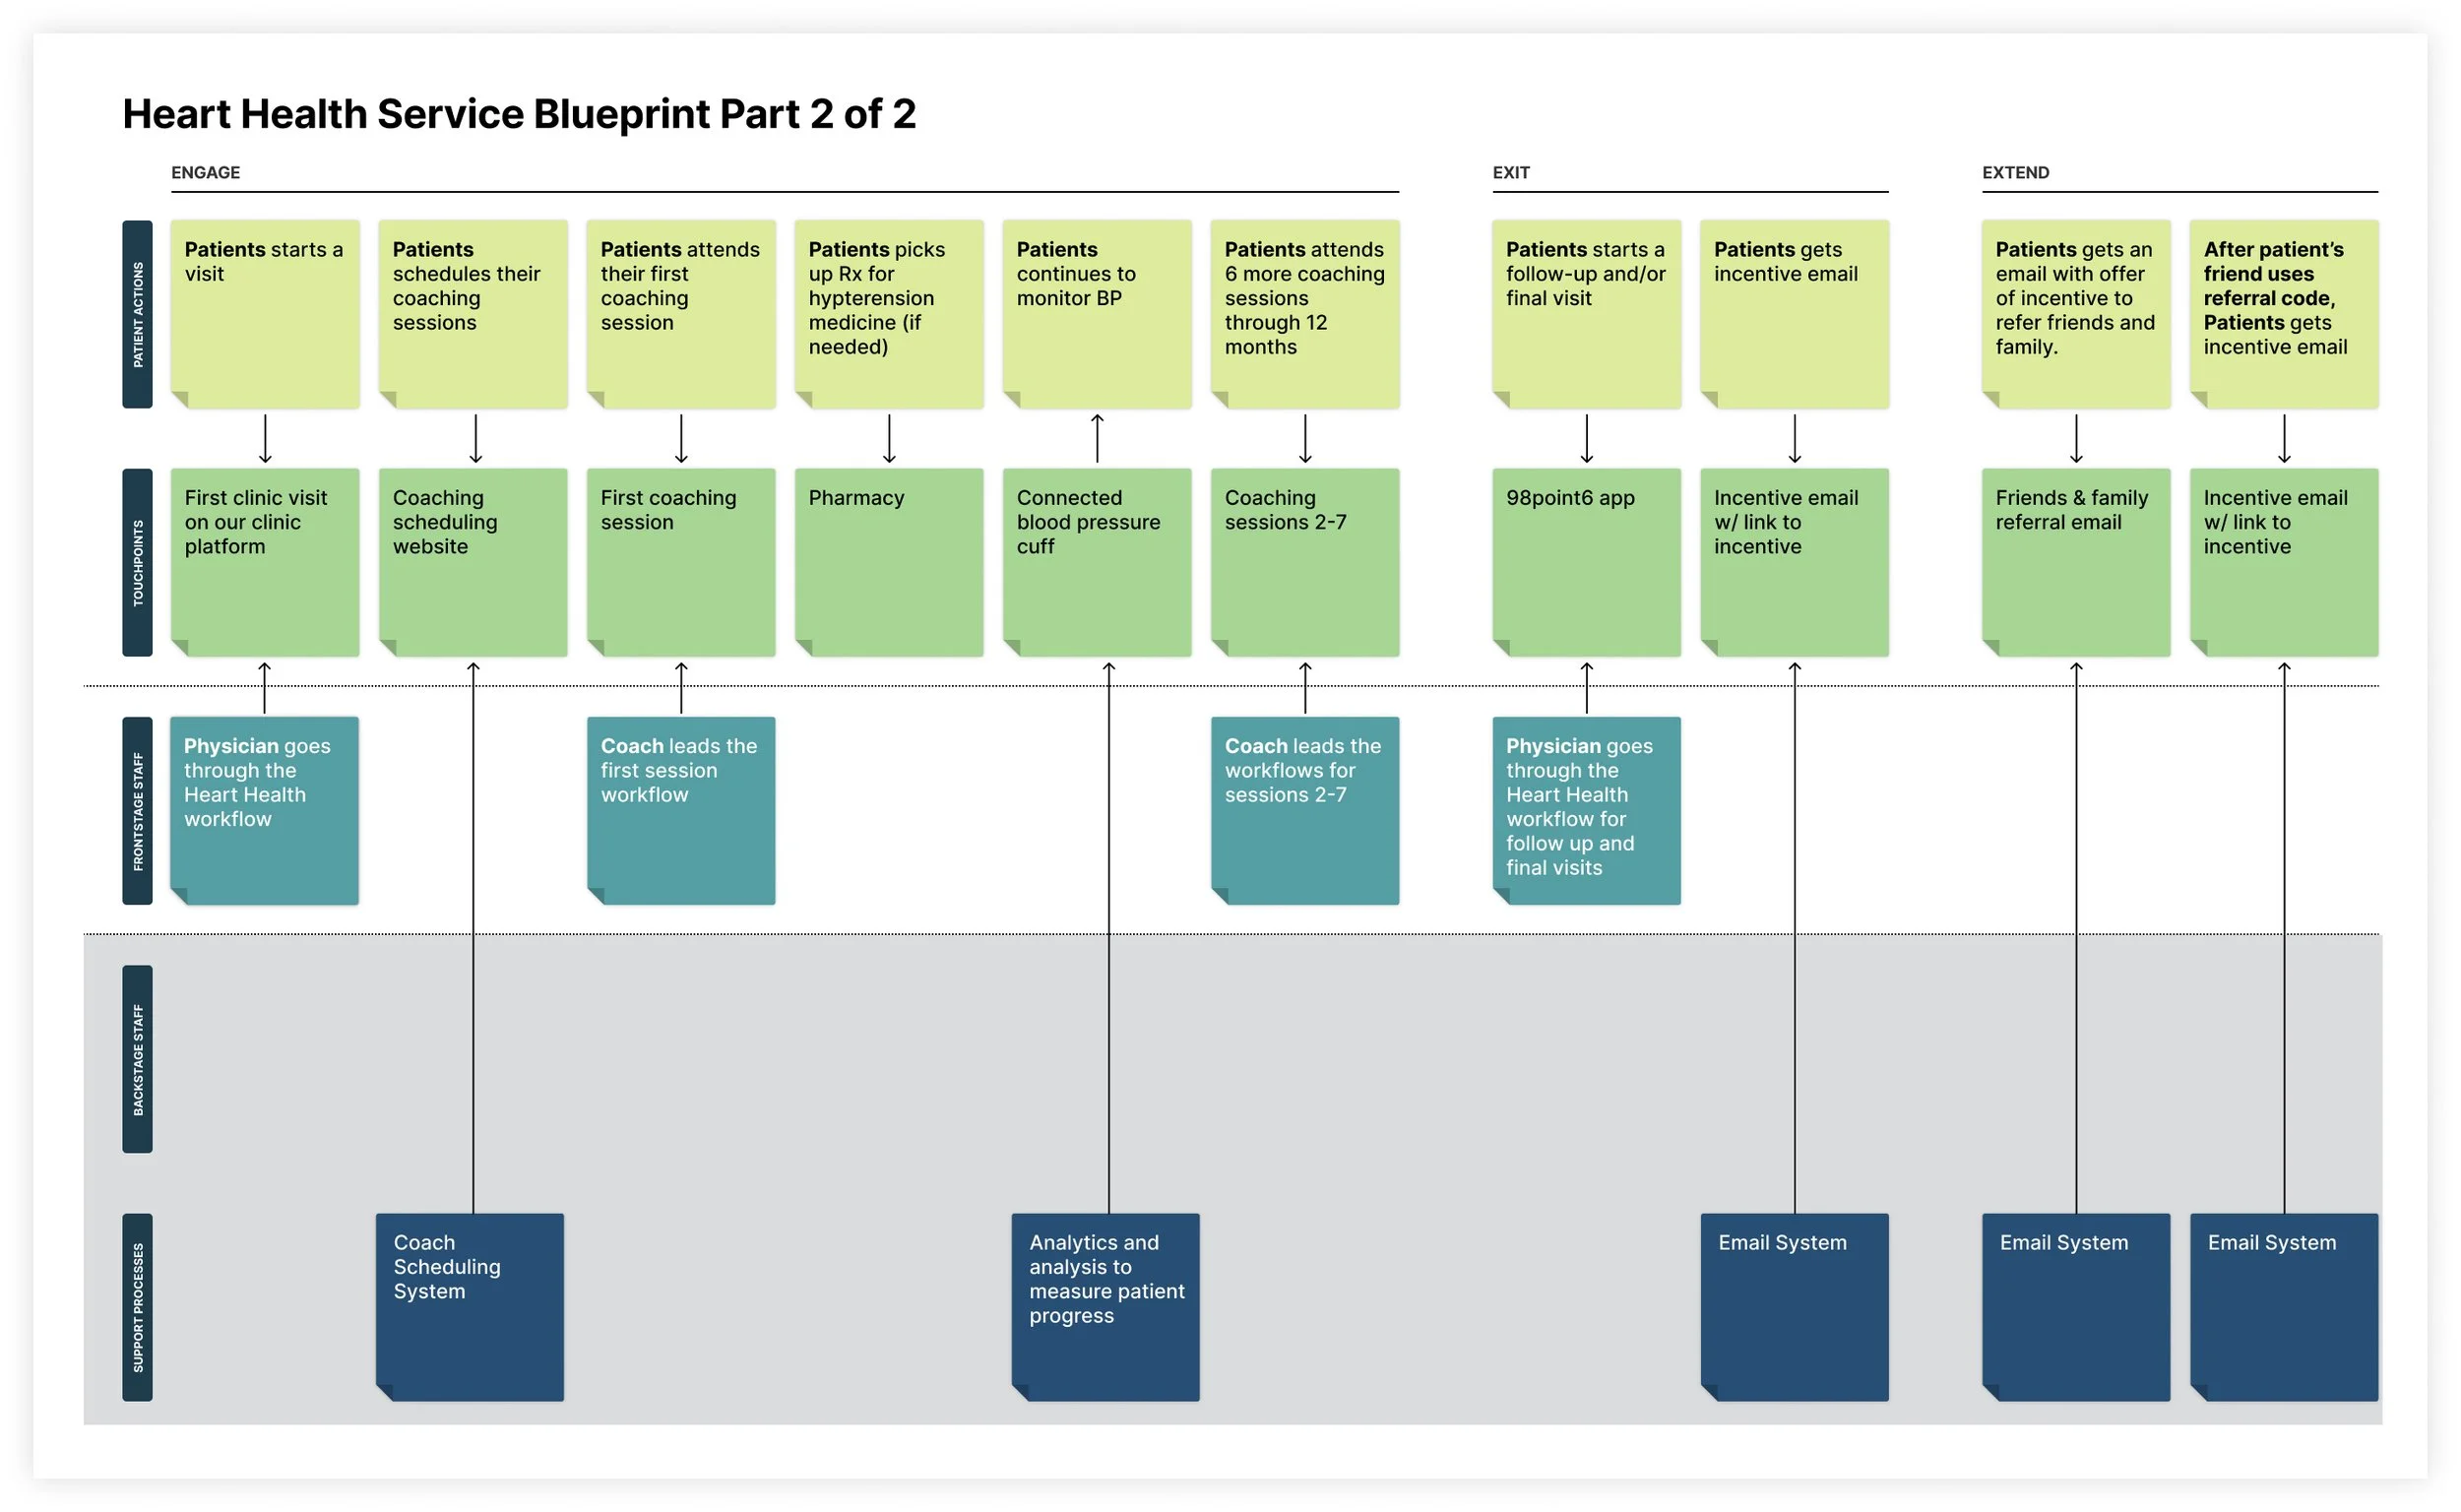
Designing for every touchpoint and driving alignment for a cross-team strategy
This project signaled a huge pivot for our company which to date, had a nearly-single channel patient experience in our mobile app. As we pivoted from on-demand primary care to a longitudinal program, a huge variety of touch points come into play. To make sure we are providing a seamless patient experience across these varied touch points, I took a service design approach and created a service blueprint with my early hypothesis for how the program could work.
This 0-to-1, horizontal project required alignment and collaboration across nearly every team: marketing, analytics, legal, compliance, product, engineering, behavioral health, clinic, partnerships, and safety. To build early alignment across these disparate teams, we used this service blueprint as a focal point for our early conversations.

Feedback on the Service Blueprint
Cara - Thank you for your collaboration, innovation, high intensity and critical and informed thinking over the past 3 weeks as we worked through the gaps and dependencies of the HH Program. And thank you for introducing me to the Service Blueprint tool and the 5Es! Looking forward to more collaboration in the new year as we get ready to launch this program.
–Medical Director, Clinical Program Development
Adapting a care platform for a whole new world
To date, our care platform was optimized for episodic, primary care. For example, if I get an ear infection, I can open my app and within minutes be texting with a board-certified physician who can examine, diagnosis, and treat my infection by sending a prescription to my local pharmacy. With a pivot into a longitudinal care program that blends our on-demand, text-forward clinic with video-based coaching, and connected blood pressure cuffs, there was a big need to expand and adapt the functionality of our platform.
Key Design Challenges:
Leading physicians through an incredibly complex workflow.
Facilitating informed consent to participate in the program and recording that consent.
Surfacing longitudinal data from connected blood pressure cuffs in a way that makes it easy for physicians make medical decisions, even if they are new to caring for hypertension patients.
Connecting patients to video-based behavior change coaches.
Automating instructions follow-up visits.
Creating a program management tool to provide admin support for the program.
Design Exploration
To transition from the service blueprint to design, I spent a week sketching and exploring different approaches.
A few of the final designs
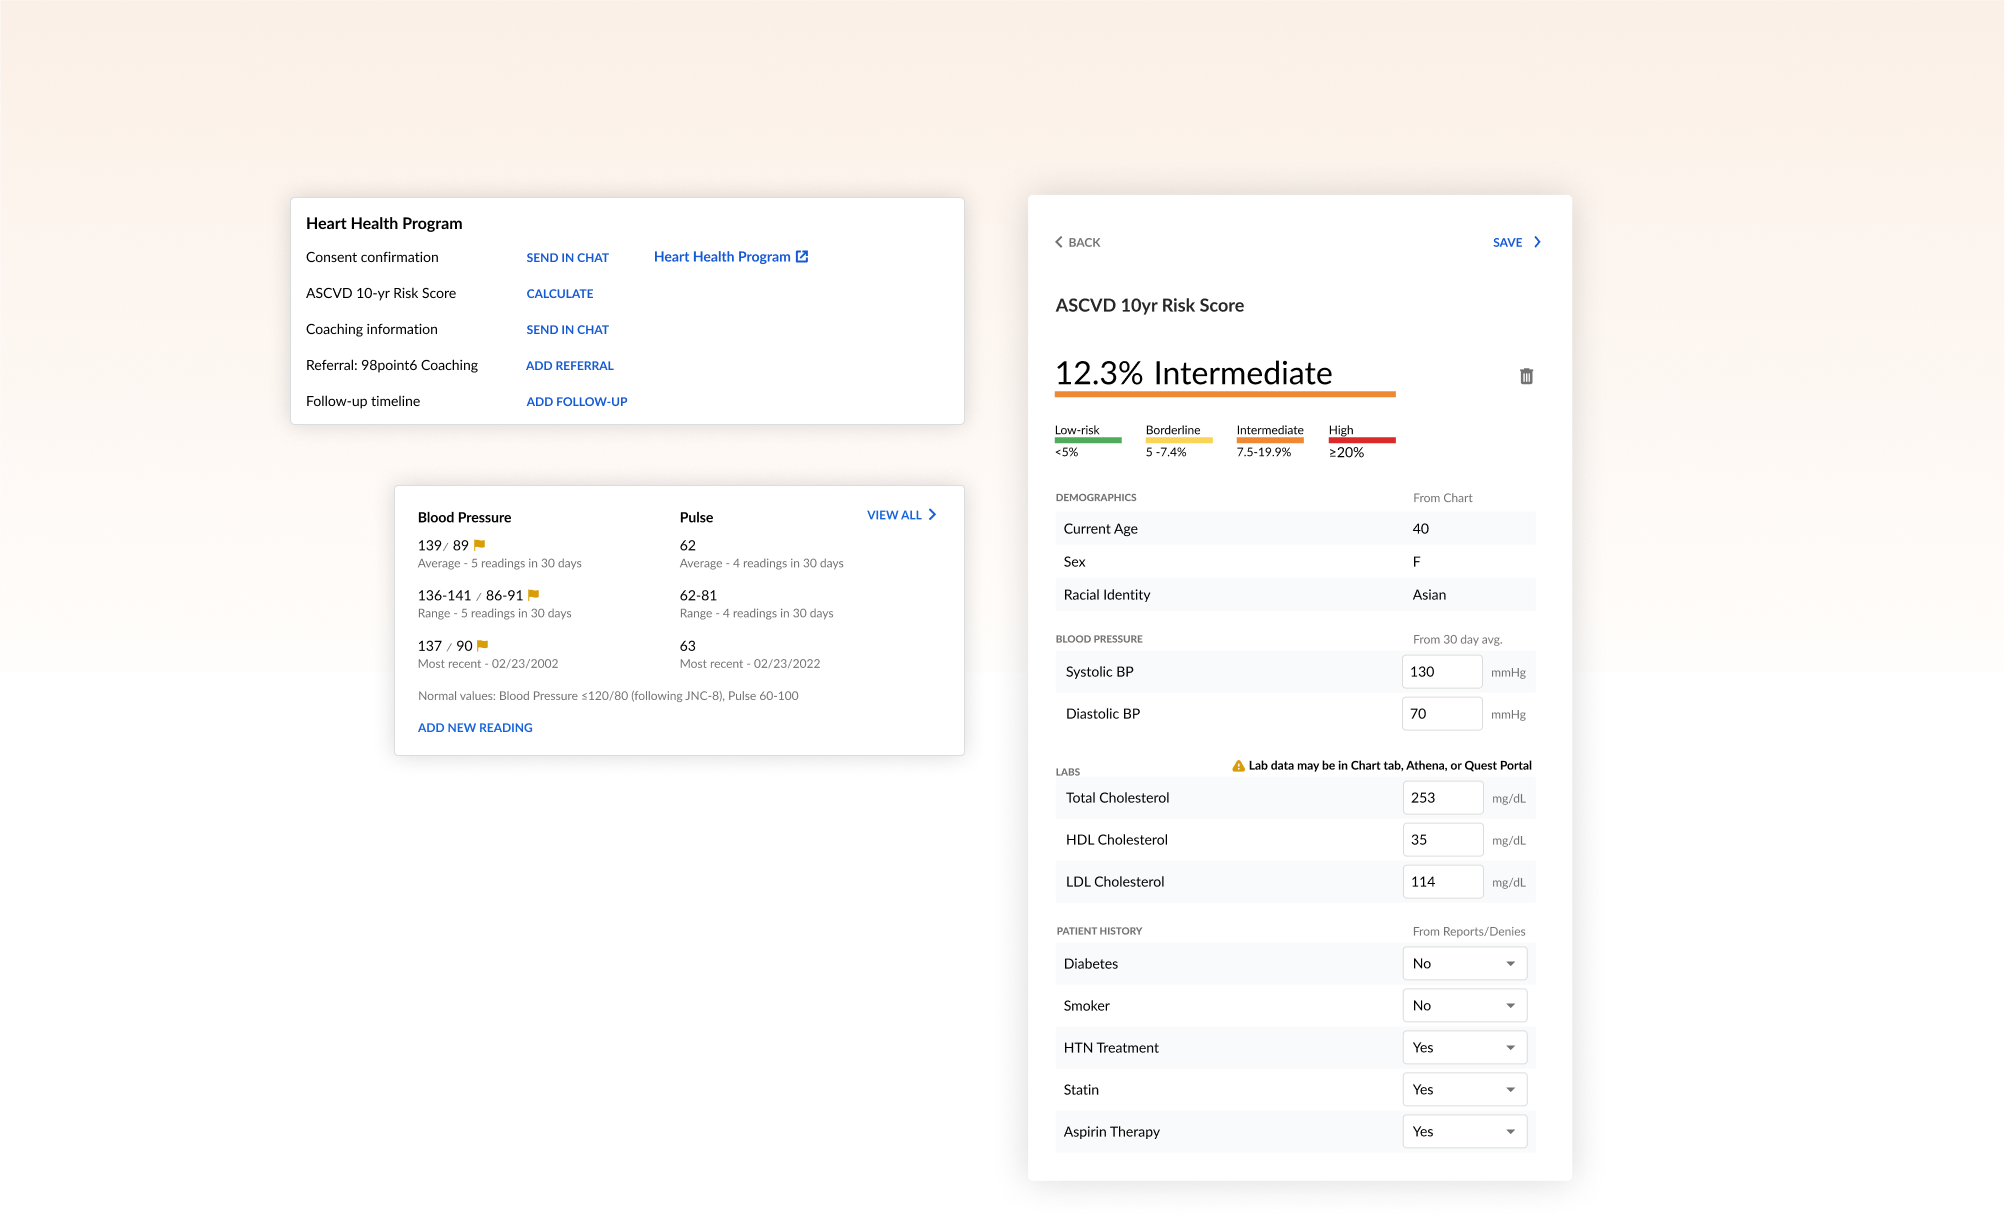
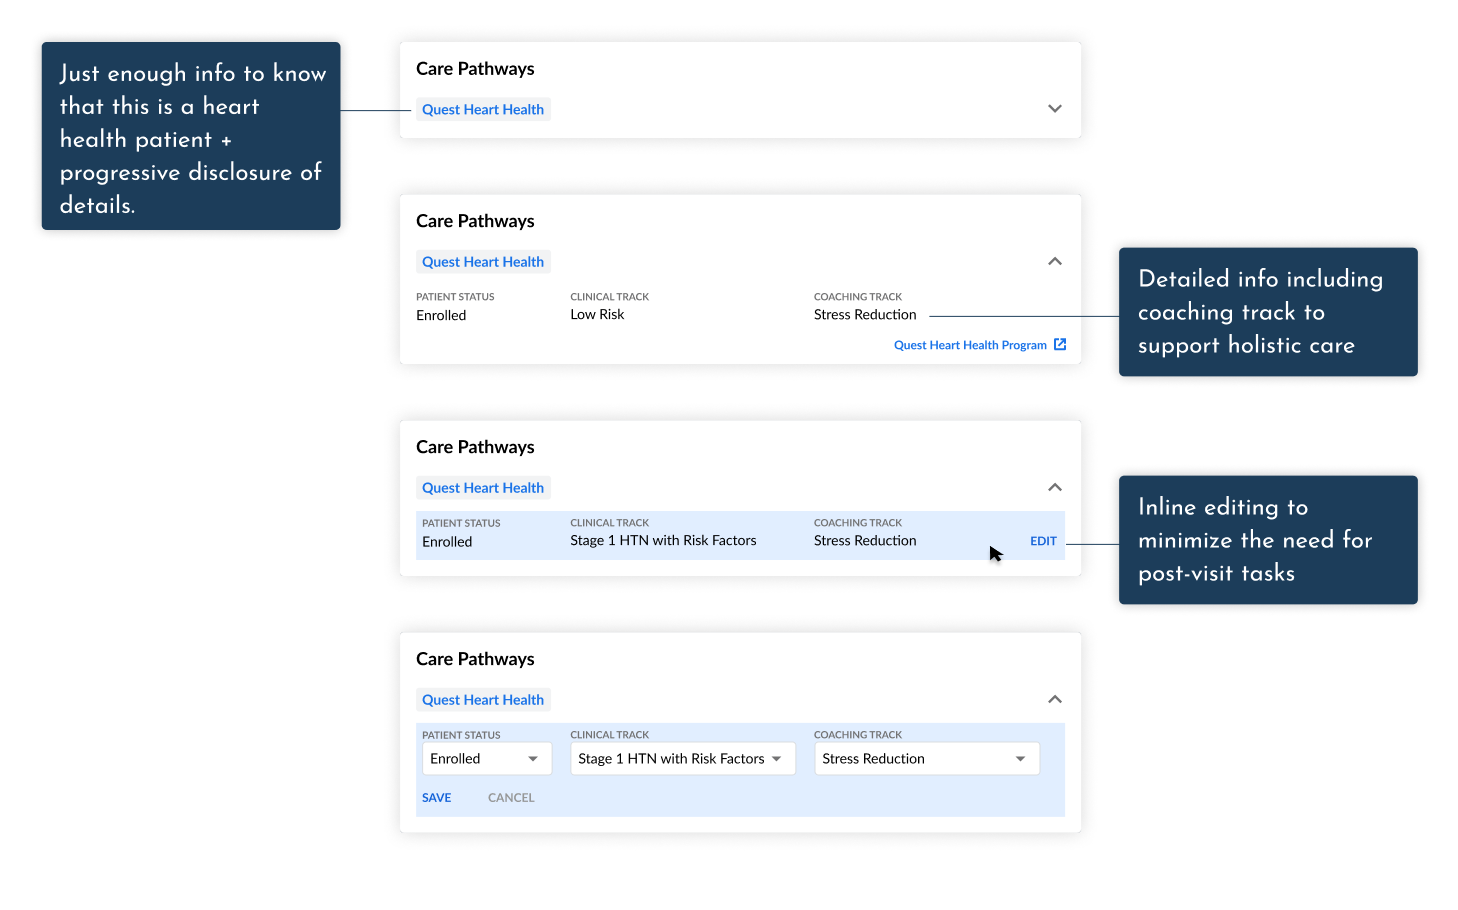
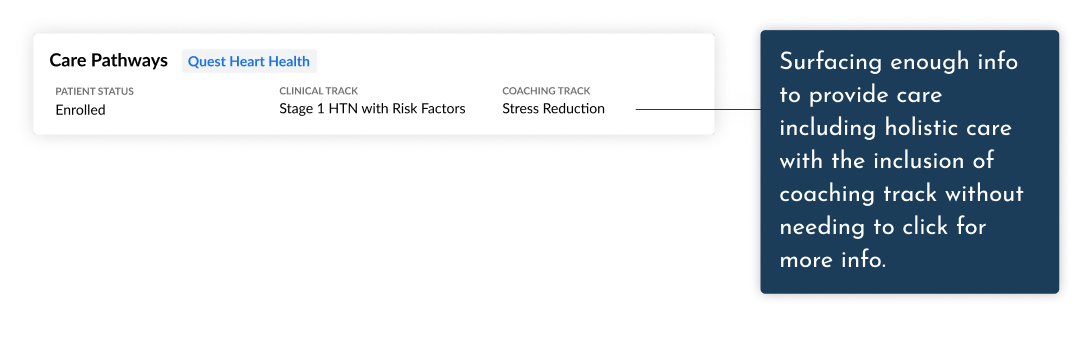
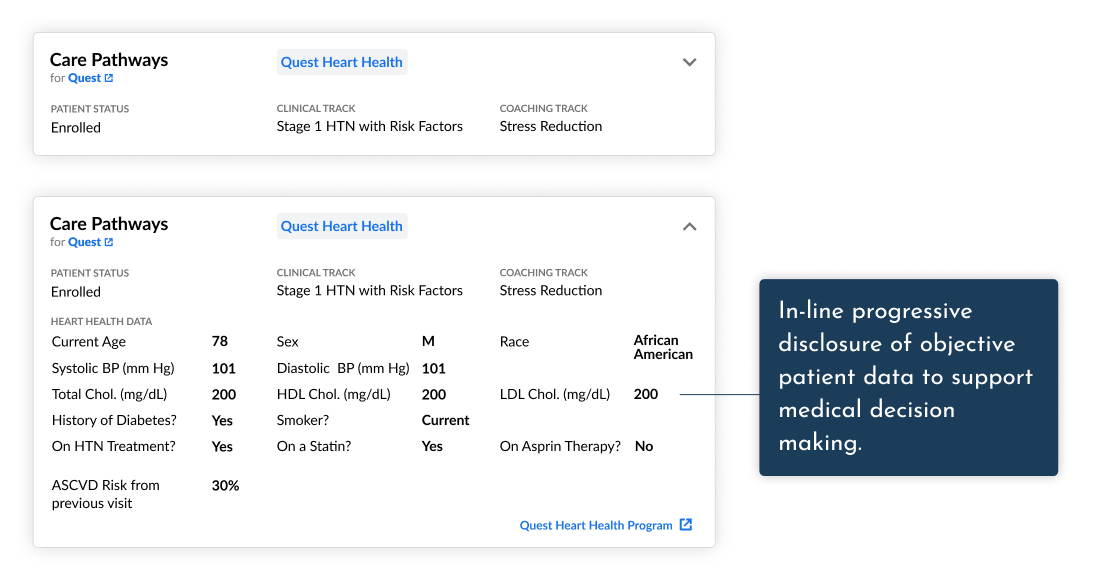
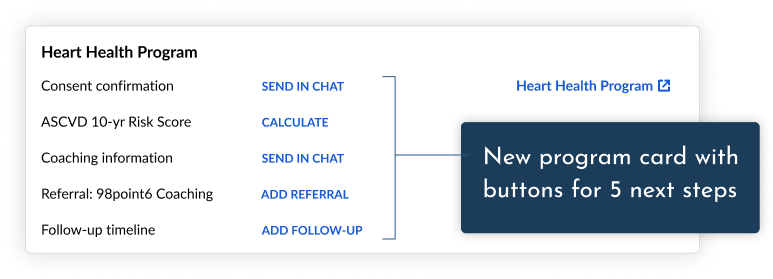
Concept: A program card to identify a patient’s enrollment in the program, surface a series of buttons that automate/augment the key actions, and a link to more information.
Approach: Clear next steps to reduce cognitive load
Desired Outcome: Physicians what to do next during each Heart Health program visit
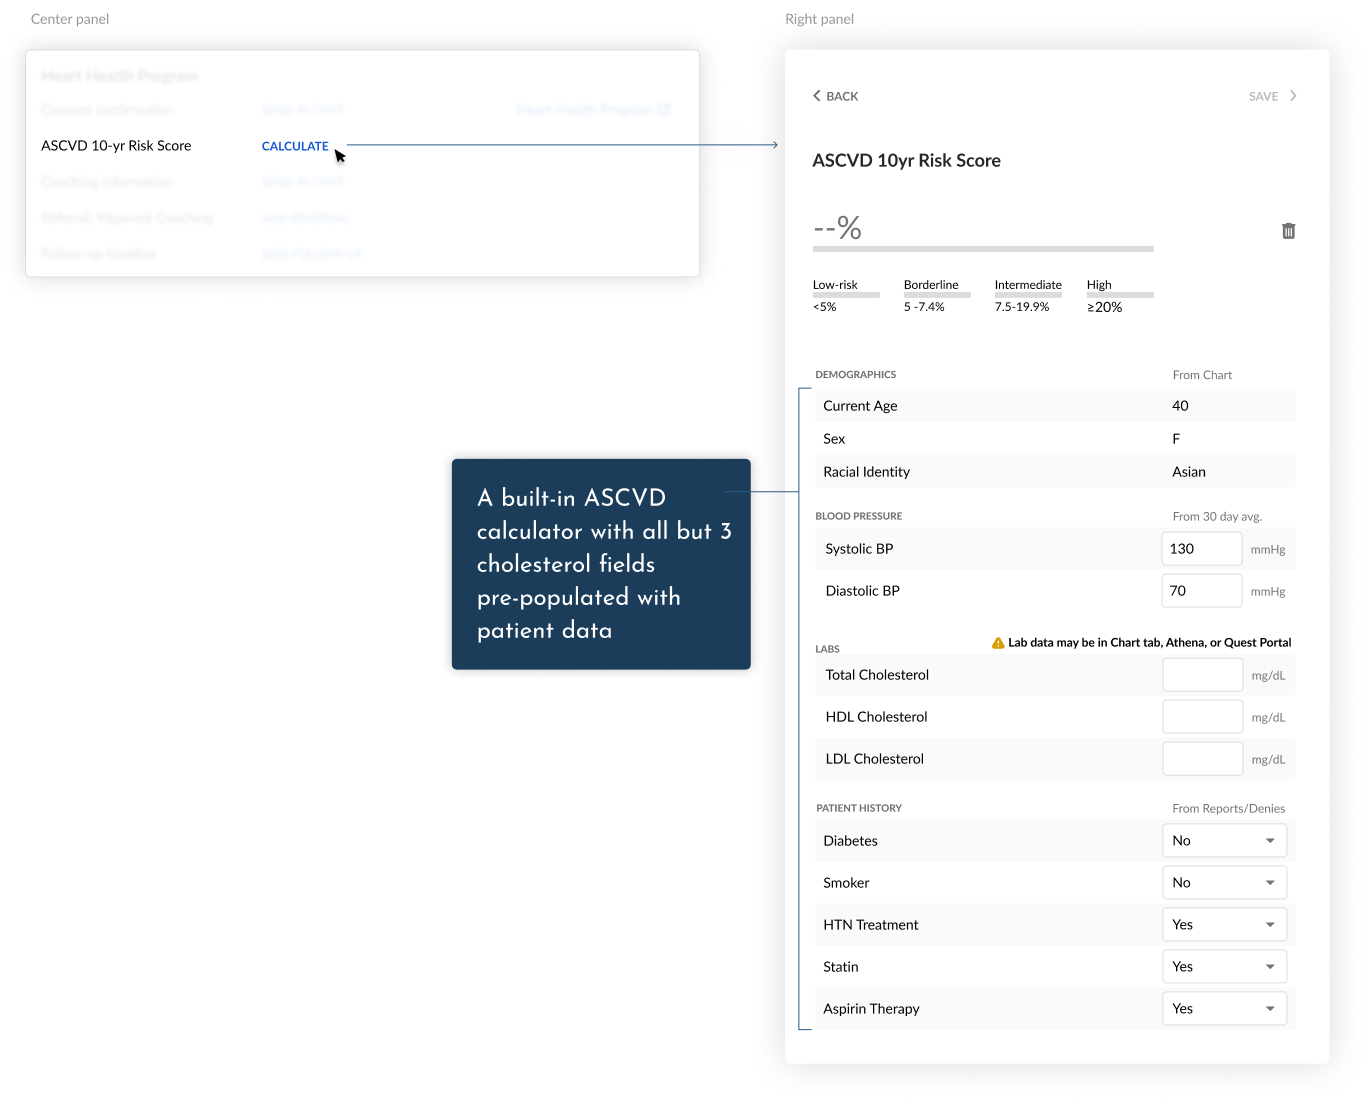
Concept: A built-in ASCVD calculator, a tool used to calculate a patient’s risk of having a cardiovascular problem, such as a heart attack.
Approach: Minimize frustration and potential for error of making physicians copy/paste info into a publicly available online calculator by building our own built-in calculator and pre-populating it with as much patient data as possible.
Desired Outcome: Physicians can can easily, consistently, and confidently make informed medical decisions based on a patient’s objective heart health data.
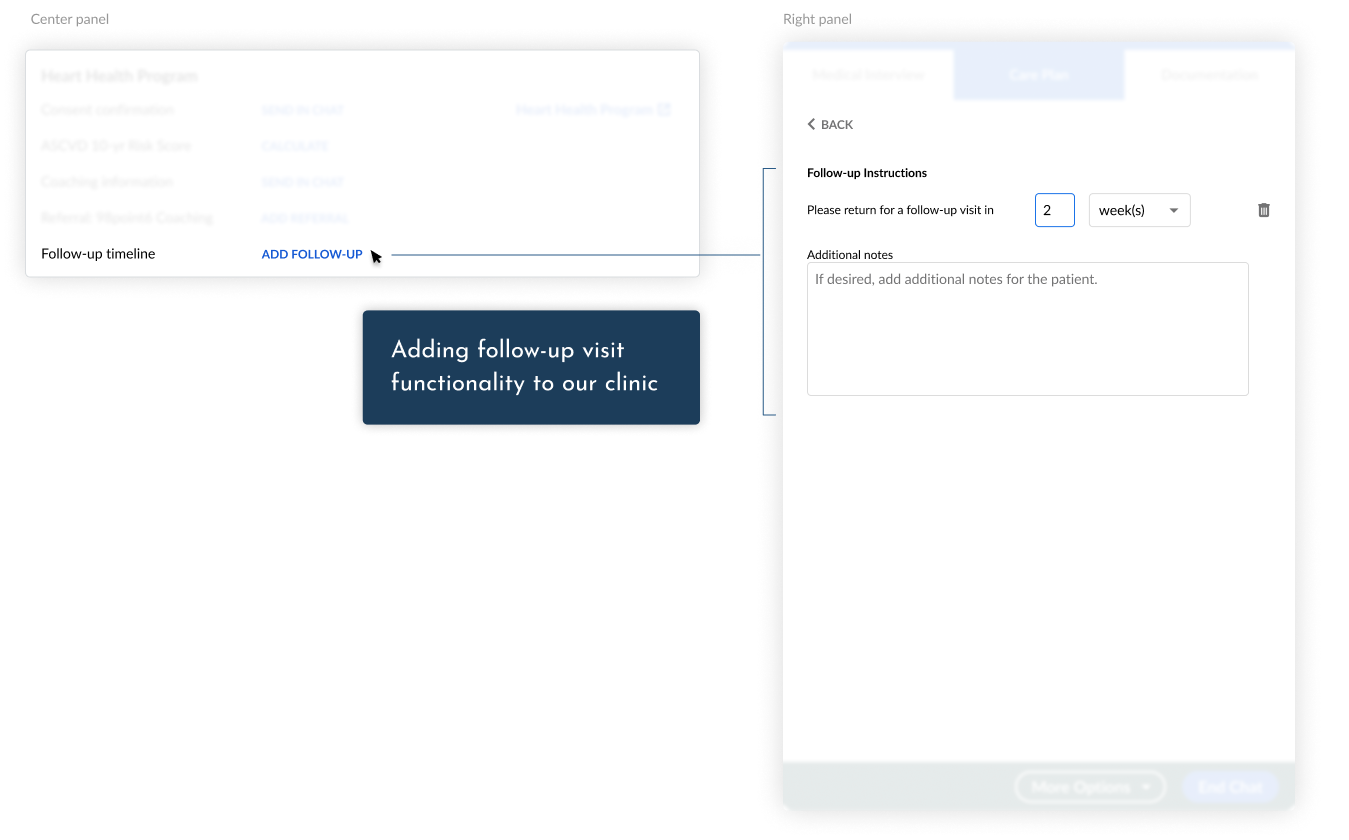
Concept: Follow-up visit functionality
Approach: Make it easy to add follow up instructions by providing a button in the program card, by defaulting the unit of measure to weeks as that is the most frequent unit of time, and if a physician fails to include these instructions, create friction to inspire them to do so before the end of the visit.
Desired Outcome: Patients are given follow-up visit instructions for every visit in the Heart Health Program.
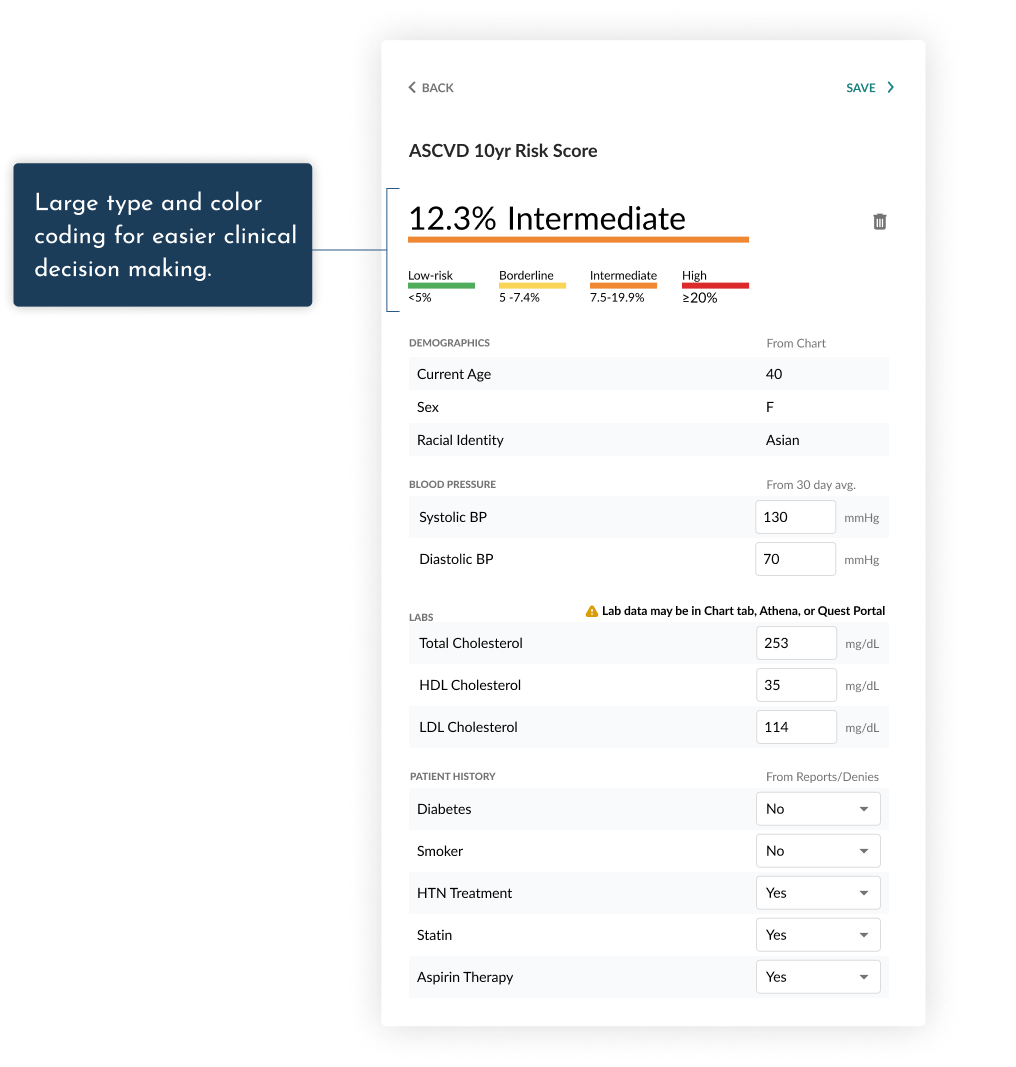
Concept: At-a-glance medical decision making
Approach: I co-designed a few options for the results with one physician and then tested several options with five physicians and found this large type and green/yellow/orange/red color coding system to be most effective.
Desired Outcome: Physicians can can easily, consistently, and confidently make informed medical decisions based on a patient’s objective heart health data.
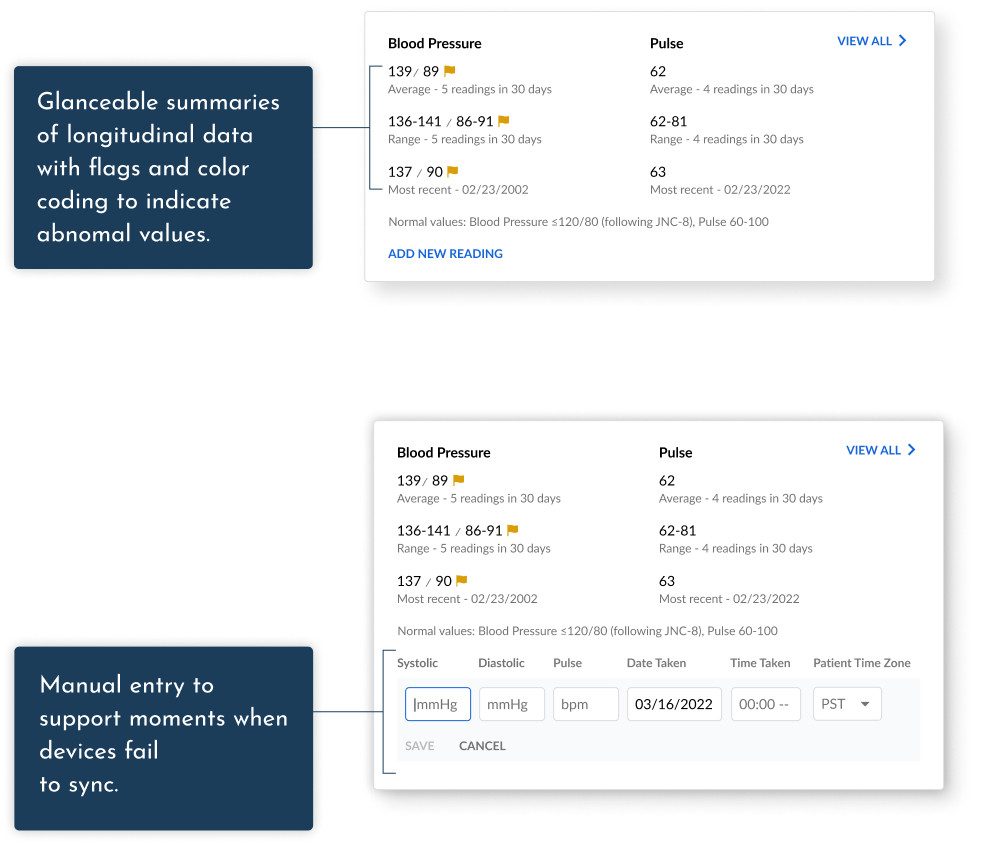
Concept: A vitals card with summaries of longitudinal blood pressure and pulse data from connected devices.
Approach: I worked with a hypertension SME to best understand which data summaries would be needed for medical decision making in the Heart Health Program. We decided on surfacing the most recent, average, and range of readings in the past 30 days along with the ability to view all data for deeper understanding when needed. If for some reason a device fails to sync with our platform, physicians can manually enter data.
Desired outcome: Physicians can can easily, consistently, and confidently do the right thing based on a patient’s objective data relevant to the HH program.
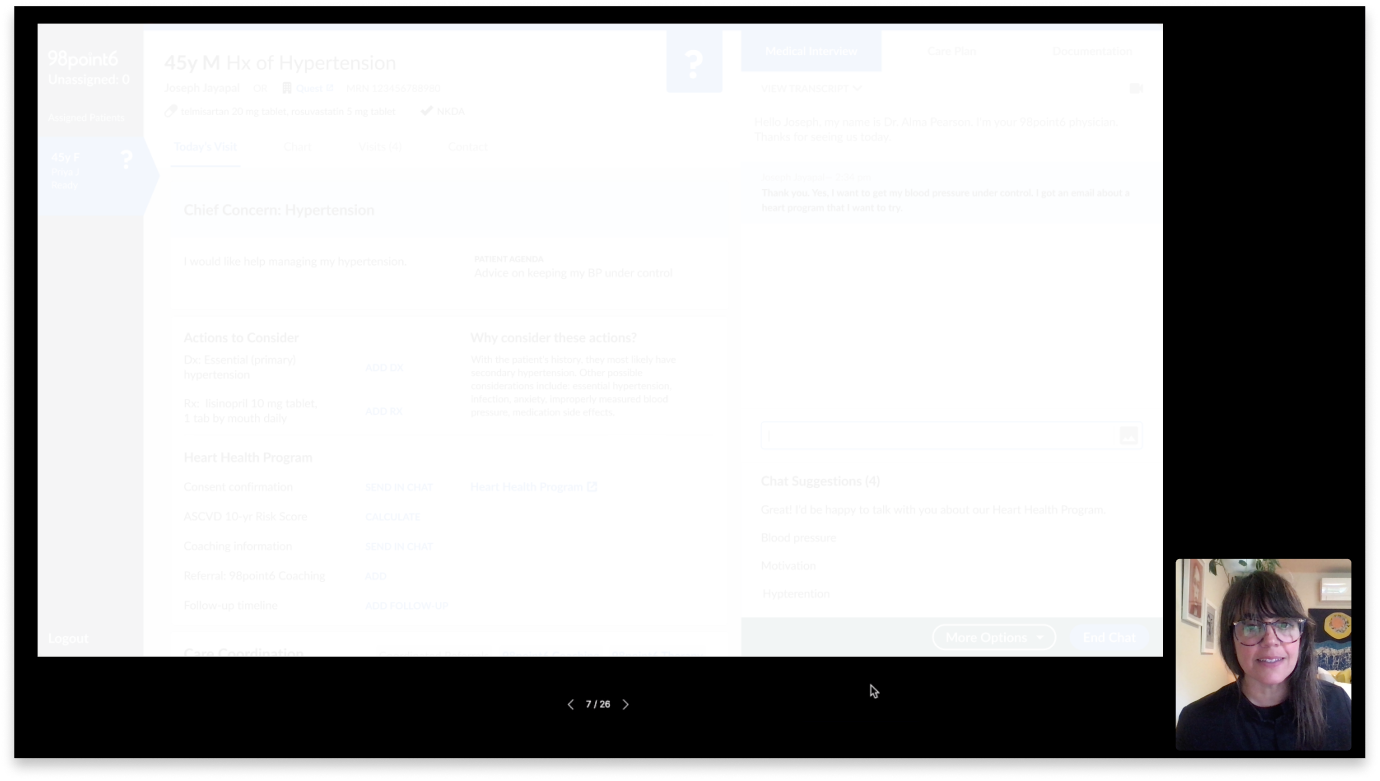
Inspiring confidence with a roadshow
Concept: A live (and recorded) demonstration followed by time for Q&A at meetings with our physicians.
Approach: I walked through an end-to-end visit in our Heart Health Program using a Figma prototype to our various physician groups as well, as at our company-wide show-and-tell meeting.
Desired outcome: Physicians feel set up for success and are exciting about supporting the Heart Health Program.
Feedback about the roadshow
“Cara - Thank you for presenting the HH designs to the medical team yesterday! It is wonderful to see all the designs coming together. I know the physician group appreciates the focus and your approach to creating designs and flow that will reduce cognitive burden for the physicians.”
– Medical Director, Clinical Program Development
Figma documentation to manage stakeholders and support engineering
Concept: One place for all key design content about the Heart Health Program
Approach: Figma documentation including links to relevant documents, problem framing, what is in scope and out of scope, success metrics, key decisions, patient journey, links to demos, and redlines.
Desired outcome: Stakeholders, Engineers, and QA can self-serve content about the project and have once central location for associated links including problem framing, key product decisions/rationale, demo videos, and links to hand-off pages.
Outcomes
To measure the success of our program we will be measuring patient progress at 6 and 12 months.
Engagement
70% of enrolled patients complete the program. Average number of unique BP measurements (as recorded in the device) is 7 times per week.
Controlled Blood Pressure
55% of participants who had uncontrolled BP that are now controlled (<130/80) at 6-months.
Patient Satisfaction
In-App Feedback star ratings weekly average 4.
Feedback about my performance on this project
Cara has done a great job leading through ambiguity to support the Heart Health program. Cara has patiently onboarded new PMs to the project. The overview videos and walkthroughs she puts together help align the cross-functional team and she is exceptionally collaborative in problem solving. Thank you for all you are doing, Cara!
– Director of Product Management, 98point6
Cara uses smart questions, new-to-us approaches, and a bias for action to solve some of our hardest design problems. As importantly, the way that she works is a bar-raising model for others.
– Director of Product Design & Research, 98point6